

This is a locked historical snapshot for Tribeca. These figures are permanent and will not change, even if later corrections are made to the live report. Locked August 5, 2026.← Back to Archive
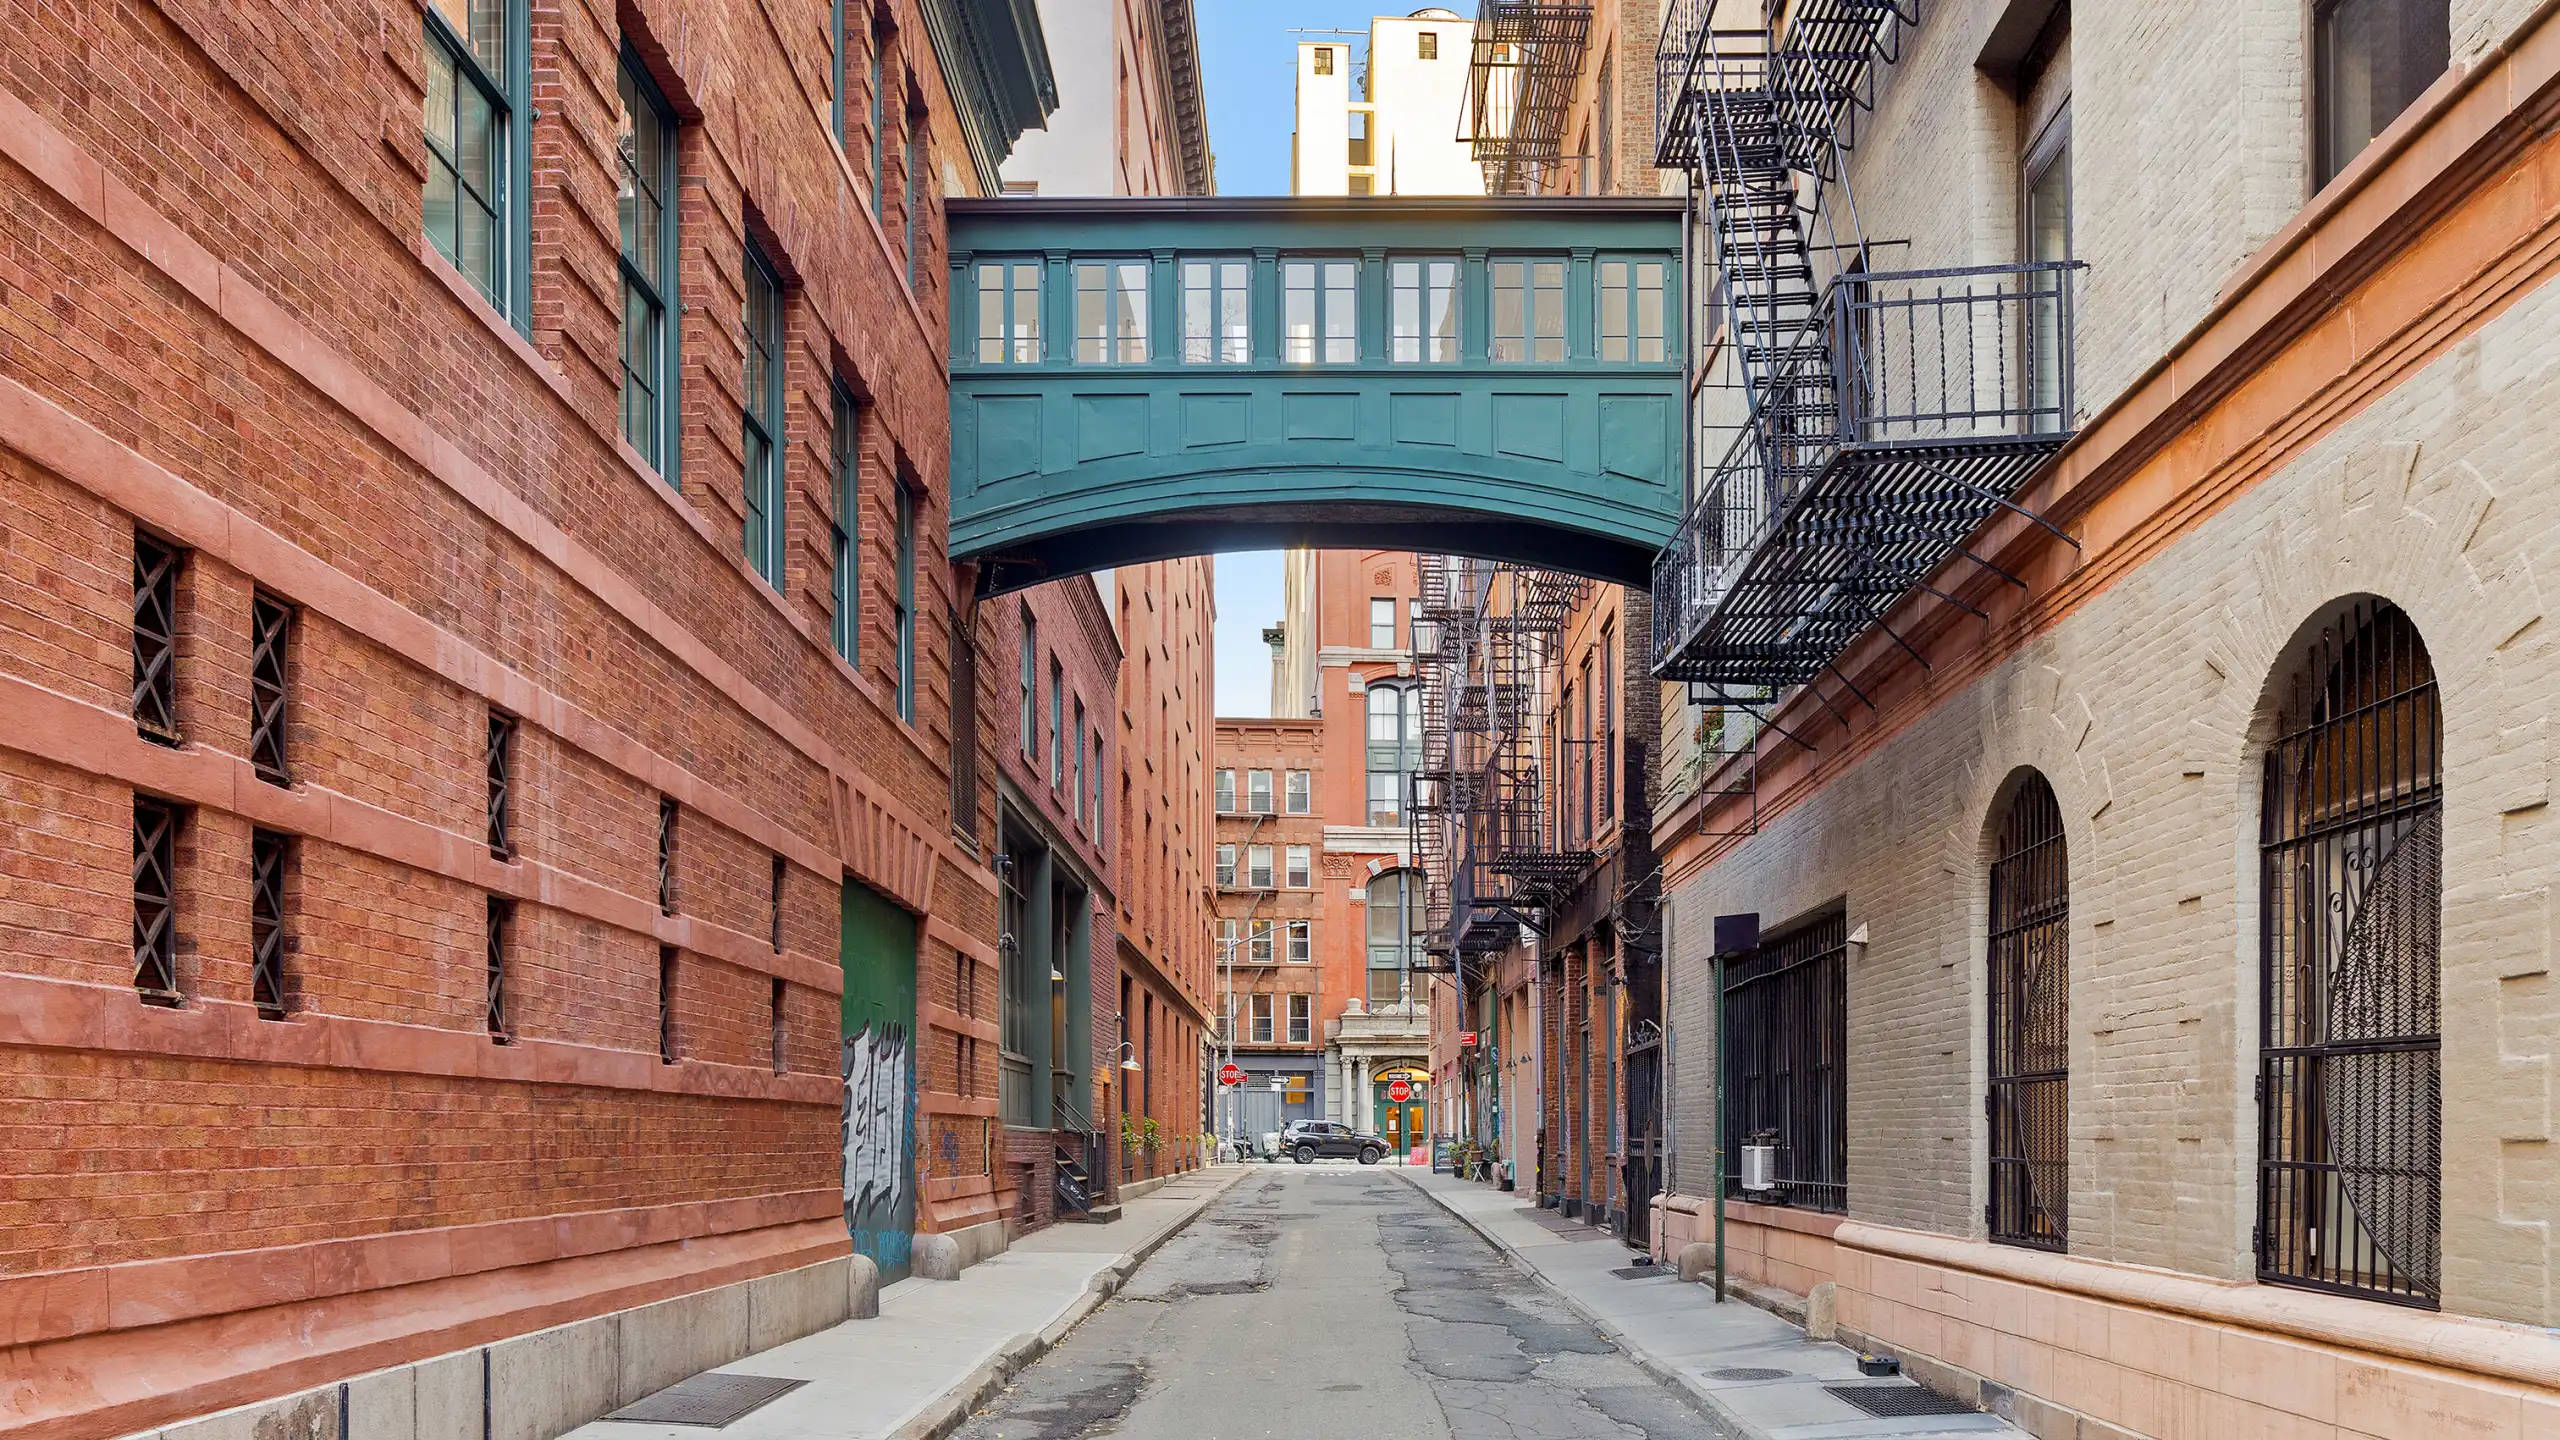
The historic Staple Street sky-bridge in Tribeca, a teal enclosed walkway connecting two brick warehouse buildings above a quiet cobblestone alley lined with cast-iron fire escapes and arched barred windows.
Domi Data™ · Luxury Lines

Manhattan Luxury: Tribeca
July 2026

ContentsContents
#7on luxury intensity
$6.50Mmedian deal, below the $7.10M borough luxury median▼ 8%
Trailing 12 months as of July 2026. Ranks cover neighborhoods with at least 11 luxury contracts over the trailing 52 weeks.
Market structure · July 2026

The Luxury Lines

Three tiers measured by the trailing 12 months of Manhattan-wide signed contracts. These entry prices are Manhattan-wide thresholds, not Tribeca's own line — paired here with Tribeca's own trailing-12-month contract count, average price per square foot, and dollar volume against each tier. Thresholds update weekly as new data enters the window.

LUXURY (TOP 10%)
$4.86M+Current floor
46
Contracts · Trailing 12 mo. · Tribeca
Avg price / sq ft · Tribeca
$2,364
Volume · 12 months · Tribeca
$264.1M
PRIME (TOP 5%)
$7.13M+Current floor
30
Contracts · Trailing 12 mo. · Tribeca
Avg price / sq ft · Tribeca
$2,688
Volume · 12 months · Tribeca
$292.2M
TROPHY (TOP 1%)
$18.19M+Current floor
3
Contracts · Trailing 12 mo. · Tribeca
Avg price / sq ft · Tribeca
$5,532
Volume · 12 months · Tribeca
$112.5M
Tribeca Pace · Trailing 12 Months
712% vs 12mo
12-mo avg contracts/mo
8 a year ago
5.362% vs 3mo
3-mo avg contracts/mo
This month's 2 vs. the 5.3 pace
Tribeca Luxury Pricing (Top 10%) · July 2026
$2,33918% MoM
Median Price Per Sq Ft, Top 10%
Jun: $1,984
$6.03Mflat MoM
Median Luxury Deal Price, Top 10%
Jun: $6.00M
Both figures cover contracts at or above the Top 10% line, currently $4.86M.
This month's headliners · July 2026

Top Tribeca Deals

Tribeca's highest signed-contract prices this month.

Address
SF
$/SF
DOM
Type
Price
79 Laight Street, Unit 5C
2,888
$2,112
301d
condo
$6,100,000
66 Leonard Street, Unit 12A
2,319
$2,566
260d
condo
$5,950,000
No third qualifying deal reported
Luxury segment total · July 2026What countsAll contracts at or above the Top 10% line, currently $4.86M. The three columns assign each contract once: Luxury is Top 10% to 5%, Prime is Top 5% to 1%, and Trophy is Top 1%.
2
Contracts
50% MoM
$12.05M
Dollar volume
▼ 8% MoM
Luxury · Top 10% to 5%
$4.86M 4% YoY
Contracts
2
Volume
$12.05M
Blended $ / sq ft
$2,314
Avg days on market
281 days
Prime · Top 5% to 1%
$7.13M 9% YoY
Contracts
0
Volume
$0
Blended $ / sq ft
Avg days on market
Trophy · Top 1%
$18.19M
Contracts
0
Volume
$0
Blended $ / sq ft
Avg days on market
Only 2 deals this month. Too thin to read. Refer to the 3-month trend.
Tribeca's Manhattan position
Tribeca ranks 7th for luxury intensity, the share of its contracts clearing the Manhattan Luxury (Top 10%) price line: 81 of 249 trailing contracts, or 33%. Size and concentration are different things, so a neighborhood can move large dollar volume without a high share of its deals clearing the luxury line. The median of those Tribeca deals is $6.50M, 8% below the $7.10M median for all Manhattan Luxury (Top 10%) deals.
Sellers: Measure against qualified Tribeca luxury deals and the Manhattan Luxury (Top 10%) median.
Buyers: Compare like with like, using deals above the same Manhattan Luxury (Top 10%) price line.
Tribeca · month over month · July 2026

Tribeca Market Pulse All Price Points

17*
Signed contracts · Tribeca
▲ 13% MoM
vs 12-mo avg
$50.18M*
Total dollar volume · Tribeca
▼ 8% MoM
vs 12-mo avg
Condos
Signed contracts*
14
Recorded sales
27
Avg $/sq ft
$2,072
▼ 3.3% MoM
Discount from ask
-6.7%
▲ 3.5pp MoM
Avg DOM · all sales
98d
▼ 6d MoM
Co-ops
Signed contracts*
3
Recorded sales
4
Avg $/sq ft
$1,997
▲ 41.6% MoM
Discount from ask
-3.0%
Avg DOM · all sales
80d
▼ 77d MoM
Townhouses
Signed contracts*
0
Recorded sales
0
Avg $/sq ft
Discount from ask
Avg DOM · all sales
Unit breakdown · July 2026

Contracts and Volume by Unit Size

Where activity concentrates in Tribeca's contract market by bedroom count. Includes all price tiers.

Dollar volume

Donut chart of Tribeca dollar volume by bedroom count across 5 categories totalling $47.9 million. Largest is 3-Bed at $30.6 million, 64 percent of the total. Smallest is 4+ Beds at $0.0 million, 0 percent. Full breakdown: 3-Bed $30.6 million, 64 percent; 2-Bed $12.9 million, 27 percent; 1-Bed $4.4 million, 9 percent; Studio $0.0 million, 0 percent; 4+ Beds $0.0 million, 0 percent.

Tribeca dollar volume by bedroom count
BedroomsDollar volume
Studio$0.00M
1-Bed$4.37M
2-Bed$12.89M
3-Bed$30.63M
4+ Beds$0.00M
Contracts signed

Donut chart of Tribeca contracts signed by bedroom count across 5 categories totalling 16. Largest is 3-Bed at 8, 50 percent of the total. Smallest is 4+ Beds at 0, 0 percent. Full breakdown: 3-Bed 8, 50 percent; 2-Bed 5, 31 percent; 1-Bed 3, 19 percent; Studio 0, 0 percent; 4+ Beds 0, 0 percent.

Tribeca contracts signed by bedroom count
BedroomsContracts
Studio0
1-Bed3
2-Bed5
3-Bed8
4+ Beds0
What this means for you
3-Bed residences accounted for 64% of Tribeca's luxury dollars and were the most active segment this month, with $30.63M moving across 8 signed contracts. Sellers of 3-Bed are in the segment carrying both the dollars and the activity, so recent closed comparables are current rather than stale. Buyers at other sizes face a thinner field of competing bids and can negotiate on that basis.
Tribeca supply · active listings · July 2026

Supply and Absorption

What inventory exists in Tribeca, how fast it's moving, and what that means for buyers and sellers right now.

Luxury market · Manhattan $4.86M+
Active listings
59
28% MoM
Months of supply
8.8mo
9+ months = Luxury Buyer's Market
Monthly absorption
11.4%
12-mo contract pace vs. active supply
All Tribeca residential
Active listings
129
3% MoM
Months of supply
6.3mo
6+ months = Buyer's Market
Monthly absorption
15.9%
12-mo contract pace vs. active supply
Key Takeaway

At ~9 months of luxury supply, Tribeca is balanced and sits looser than the borough. Neither side has a structural edge.

Sellers: Price to the data and lead with a clean listing.

Buyers: You have room to make a strategic offer. Look closely within your submarket. Building-by-building comps carry the clearest signal.

Your Next Step

Your residence may not move with the neighborhood average. Please for a comparative read on your address.

The confirmation layer

Explore the Data

Recorded sales, price history, and unit-size breakdowns. The lagging view that confirms the contract signals above.

Tribeca Luxury Quarterly Contracts by Tier
Tribeca · fixed Manhattan-wide cutoffs · 2022-04-012026-07-01*

Line chart of Tribeca luxury quarterly contracts by tier covering 18 periods from 2022-04-01 to 2026-07-01. $4.86M+ falls from 13 in 2022-04-01 to 2 in 2026-07-01, down 85 percent, peaking at 31 in 2025-04-01. $7.13M+ falls from 6 in 2022-04-01 to 0 in 2026-07-01, down 100 percent, peaking at 15 in 2023-01-01. $18.19M+ falls from 2 in 2022-04-01 to 0 in 2026-07-01, down 100 percent, peaking at 3 in 2023-07-01 and bottoming at 0 in 2024-04-01.

Tribeca luxury quarterly contracts by tier
Quarter$4.86M+$7.13M+$18.19M+
2022-04-011362
2022-07-011661
2022-10-0116102
2023-01-0130151
2023-04-012491
2023-07-0115103
2023-10-011561
2024-01-011861
2024-04-011960
2024-07-011250
2024-10-0126121
2025-01-0127143
2025-04-0131151
2025-07-011781
2025-10-0124130
2026-01-012291
2026-04-012180
2026-07-01200
Weekly Sales · Price
By property type

Line chart of Tribeca Weekly Sales · Price by property type covering 51 periods from 2025-08-04 to 2026-07-27. Condo falls from 10,125,000 in 2025-08-04 to 3,481,806.25 in 2026-07-27, down 66 percent, peaking at 11,244,285.714 in 2026-02-09 and bottoming at 1,230,000 in 2026-06-29. Co-op falls from 2,190,000 in 2025-08-04 to 1,650,000 in 2026-07-27, down 25 percent, peaking at 6,075,000 in 2026-04-13 and bottoming at 925,000 in 2025-09-01.

Tribeca — Weekly Sales · Price by property type
WeekCondoCo-opTownhouse
2025-08-0410,125,0002,190,000
2025-08-115,333,233.3332,208,150
2025-08-185,943,7503,515,000
2025-08-256,575,000
2025-09-013,512,500925,000
2025-09-083,615,714.2864,050,000
2025-09-155,137,5003,750,000
2025-09-222,258,333.3333,581,250
2025-09-292,193,129.52,710,000
2025-10-066,550,000
2025-10-135,325,0002,975,000
2025-10-203,128,333.333
2025-10-272,345,0002,370,000
2025-11-035,456,250
2025-11-106,649,333.333
2025-11-175,201,2501,480,790
2025-11-242,726,666.6672,900,000
2025-12-019,892,142.8571,205,000
2025-12-087,500,0002,300,000
2025-12-152,725,416.6671,700,000
2025-12-225,468,688.889
2025-12-294,471,062.4
2026-01-055,362,5001,460,000
2026-01-123,982,5005,812,500
2026-01-194,241,666.667
2026-01-264,133,333.3332,750,000
2026-02-025,690,6252,280,000
2026-02-0911,244,285.7144,825,000
2026-02-164,558,5002,800,000
2026-02-233,215,0004,498,500
2026-03-026,575,919
2026-03-095,280,937.5
2026-03-162,174,833.3333,716,666.333
2026-03-234,730,0003,762,145
2026-03-304,561,2508,000,000
2026-04-062,199,000
2026-04-134,499,081.6676,075,000
2026-04-209,666,666.6673,675,000
2026-04-27
2026-05-043,646,285.714
2026-05-113,883,000
2026-05-184,723,7501,775,000
2026-05-253,110,0002,720,000
2026-06-015,315,900
2026-06-083,845,141.4293,125,000
2026-06-154,400,833.333
2026-06-223,037,500
2026-06-291,230,000
2026-07-063,794,166.6673,893,250
2026-07-137,375,0003,575,000
2026-07-203,136,500
2026-07-273,481,806.251,650,000
Condo   Co-op   Townhouse
Weekly Sales · Discount
By property type

Line chart of Tribeca Weekly Sales · Discount by property type covering 50 periods from 2025-08-04 to 2026-07-27. Condo falls from -2 in 2025-08-04 to -8.95 in 2026-07-27, down 348 percent, peaking at 4.8 in 2025-10-06 and bottoming at -21.3 in 2025-11-24. Co-op falls from -3.5 in 2025-08-04 to -4.1 in 2026-07-13, down 17 percent, peaking at -1.8 in 2025-09-01 and bottoming at -18.6 in 2026-05-25.

Tribeca — Weekly Sales · Discount by property type
WeekCondoCo-opTownhouse
2025-08-04-2-3.5
2025-08-11-4.5-2.3
2025-08-18-4.875-7.9
2025-08-25-1.65
2025-09-01-6.45-1.8
2025-09-08-8.2-3.1
2025-09-15-10.45-2
2025-09-22-11.95-8.9
2025-09-29-0.95-6
2025-10-064.8
2025-10-13-5.2-7.6
2025-10-20-17.65
2025-10-27-5.3-6.9
2025-11-03-4.833
2025-11-10-8.033
2025-11-17-4.7
2025-11-24-21.3-4.9
2025-12-01-6.583-3
2025-12-08-6.3-13.1
2025-12-15-1.933
2025-12-22-3.425
2025-12-29-5.175
2026-01-05-8.34-18.1
2026-01-12-8.1-7.4
2026-01-19-7.9
2026-01-26-10.367-4.4
2026-02-02-5.05-4.7
2026-02-09-9.983
2026-02-16-8.2-8.3
2026-02-23-10.233-13.8
2026-03-02-7.767
2026-03-09-2
2026-03-16-13.867-9.6
2026-03-23-9.433-7.7
2026-03-30-6.817-10.4
2026-04-06-7.8
2026-04-132.55-4.4
2026-04-20-7.7-9.9
2026-04-27
2026-05-04-8.35
2026-05-11-10.367
2026-05-18-7.56
2026-05-25-15.9-18.6
2026-06-01-7.64
2026-06-08-11.725
2026-06-15-11.9
2026-06-22-11.2
2026-06-29
2026-07-06-7.275-2
2026-07-13-10.4-4.1
2026-07-20-3.814
2026-07-27-8.95
Condo   Co-op   Townhouse
Methodology & Notes

Tribeca residential signed contracts, last asking price, trailing 12 months (TTM). · Luxury $4.86M / Prime $7.13M / Trophy $18.19M = Manhattan-wide top 10%, 5%, 1% of TTM contracts. Cutoffs update monthly. · July 2026 is the latest reporting month (provisional; may revise through August 18, 2026). · Tribeca's local luxury line is the median of its own contracts that clear the Manhattan Luxury cutoff (top 10%), currently $6.50M. Consumer reference only; every Luxury figure on this page is measured against the Manhattan threshold. · In each tier card, the contract count is Tribeca's own contracts that clear that Manhattan tier. Average price per square foot and 12 month volume are Manhattan-wide totals for the tier, shown as the benchmark Tribeca is measured against, and are labeled "Manhattan" on the card. · Metrics based on fewer than 5 contracts are marked "insufficient sample" rather than shown as a percentage change. · Two rankings appear in this section, refreshed weekly. Both cover only neighborhoods with at least 11 luxury contracts over the trailing 52 weeks, the floor for a stable reading. Luxury dollar volume ranks those neighborhoods by the dollars transacted above the Manhattan Luxury (Top 10%) price line over the trailing 12 months. Luxury intensity ranks them by the share of their trailing-12-month contracts that clear that same price line.

Abbreviations

TTM · Trailing Twelve Months  ·  YoY · Year over Year  ·  QoQ · Quarter over Quarter  ·  MoS · Months of Supply  ·  DOF · Department of Finance